Datavisualization
The package only contains methods to simplify your code, so it doesn’t cover all steps of machine learning process, but only those that save you lines of code.
[1]:
#!pip install smltk==3.0.0

import os
import sys
sys.path.insert(1, os.getcwd() + '/../../../')
print(os.getcwd())
print(sys.path)

from smltk.data_processing import DataProcessing
from smltk.modeling import ObjectDetection
dp = DataProcessing()
od = ObjectDetection()
/home/bilardi/github/bilardi/smltk/docs/source/usage
['/usr/lib64/python313.zip', '/home/bilardi/github/bilardi/smltk/docs/source/usage/../../../', '/usr/lib64/python3.13', '/usr/lib64/python3.13/lib-dynload', '', '/home/bilardi/github/bilardi/smltk/.env/lib64/python3.13/site-packages', '/home/bilardi/github/bilardi/smltk/.env/lib/python3.13/site-packages']
[nltk_data] Downloading package punkt_tab to
[nltk_data]     /home/bilardi/nltk_data...
[nltk_data]   Package punkt_tab is already up-to-date!
[nltk_data] Downloading package wordnet to /home/bilardi/nltk_data...
[nltk_data]   Package wordnet is already up-to-date!
[nltk_data] Downloading package omw-1.4 to /home/bilardi/nltk_data...
[nltk_data]   Package omw-1.4 is already up-to-date!
[nltk_data] Downloading package stopwords to
[nltk_data]     /home/bilardi/nltk_data...
[nltk_data]   Package stopwords is already up-to-date!
[nltk_data] Downloading package averaged_perceptron_tagger_eng to
[nltk_data]     /home/bilardi/nltk_data...
[nltk_data]   Package averaged_perceptron_tagger_eng is already up-to-
[nltk_data]       date!
[nltk_data] Downloading package vader_lexicon to
[nltk_data]     /home/bilardi/nltk_data...
[nltk_data]   Package vader_lexicon is already up-to-date!
Example with sklearn library - iris dataset
[2]:
from sklearn.datasets import load_iris
data = load_iris()
Datavisualization
[3]:
dp.get_df(data).head(5)
[3]:
| target | target_name | sepal length (cm) | sepal width (cm) | petal length (cm) | petal width (cm) | |
|---|---|---|---|---|---|---|
| 0 | 0 | setosa | 5.1 | 3.5 | 1.4 | 0.2 |
| 1 | 0 | setosa | 4.9 | 3.0 | 1.4 | 0.2 |
| 2 | 0 | setosa | 4.7 | 3.2 | 1.3 | 0.2 |
| 3 | 0 | setosa | 4.6 | 3.1 | 1.5 | 0.2 |
| 4 | 0 | setosa | 5.0 | 3.6 | 1.4 | 0.2 |
Preprocessing
[4]:
# splitting
from sklearn.model_selection import train_test_split
X_train, X_test, y_train, y_test = train_test_split(data.data, data.target, test_size=0.2, random_state=5)
Modeling
[5]:
# fitting
from sklearn.linear_model import SGDClassifier
model = SGDClassifier(random_state=3)
_ = model.fit(X_train, y_train)
[6]:
# testing
y_pred = model.predict(X_test)
Datavisualization
[7]:
dp.get_inference_df(data, X_test, y_test, y_pred).head(5)
[7]:
| prediction | target | target_name | sepal length (cm) | sepal width (cm) | petal length (cm) | petal width (cm) | |
|---|---|---|---|---|---|---|---|
| 0 | 1 | 1 | versicolor | 5.8 | 2.7 | 3.9 | 1.2 |
| 1 | 2 | 2 | virginica | 6.1 | 2.6 | 5.6 | 1.4 |
| 2 | 2 | 2 | virginica | 5.8 | 2.8 | 5.1 | 2.4 |
| 3 | 0 | 0 | setosa | 4.4 | 3.2 | 1.3 | 0.2 |
| 4 | 2 | 2 | virginica | 7.2 | 3.6 | 6.1 | 2.5 |
Example with torch library - image dataset
[8]:
import requests
from PIL import Image
url = 'https://www.projectinvictus.it/wp-content/uploads/2022/08/junk-food-scaled.jpg'
im = Image.open(requests.get(url, stream=True).raw)
Preprocessing
[9]:
# data preparation
import torchvision.transforms as transforms
transform = transforms.Compose([ transforms.Resize(800), transforms.ToTensor() ])
img = transform(im).unsqueeze(0)
Modeling
[10]:
# load pre-trained model instead to train it
import torch
model = torch.hub.load('facebookresearch/detr', 'detr_resnet50', pretrained=True)
model.eval();
Using cache found in /home/bilardi/.cache/torch/hub/facebookresearch_detr_main
/home/bilardi/github/bilardi/smltk/.env/lib64/python3.13/site-packages/torchvision/models/_utils.py:208: UserWarning: The parameter 'pretrained' is deprecated since 0.13 and may be removed in the future, please use 'weights' instead.
  warnings.warn(
/home/bilardi/github/bilardi/smltk/.env/lib64/python3.13/site-packages/torchvision/models/_utils.py:223: UserWarning: Arguments other than a weight enum or `None` for 'weights' are deprecated since 0.13 and may be removed in the future. The current behavior is equivalent to passing `weights=ResNet50_Weights.IMAGENET1K_V1`. You can also use `weights=ResNet50_Weights.DEFAULT` to get the most up-to-date weights.
  warnings.warn(msg)
[11]:
# fitting
prediction = model(img)
probability, boxes = od.get_inference_objects(im, prediction, 0.7)
Datavisualization
[12]:
# pretty view of prediction
od.get_inference_objects_df(probability, boxes)
[12]:
| class | probability | xmin | ymin | xmax | ymax | |
|---|---|---|---|---|---|---|
| 0 | bowl | 0.91 | 121.079941 | 743.921936 | 698.561523 | 1422.093506 |
| 0 | bowl | 0.92 | 696.310791 | 649.603210 | 1255.191162 | 1054.840454 |
| 0 | donut | 1.00 | 2140.089355 | 469.912231 | 2559.624512 | 966.051392 |
| 0 | donut | 1.00 | 1892.986938 | 816.611267 | 2523.677246 | 1351.426514 |
| 0 | cup | 0.88 | 2440.143799 | -1.122757 | 2559.945557 | 397.894745 |
| 0 | donut | 0.78 | 1279.640259 | 728.656677 | 1816.003296 | 1172.515869 |
| 0 | bowl | 0.99 | 718.509521 | 1025.902588 | 1311.592285 | 1424.917969 |
| 0 | cup | 1.00 | 1913.083984 | 1.166034 | 2337.076904 | 347.949921 |
| 0 | dining table | 0.98 | -0.428162 | 4.530998 | 2559.098877 | 1419.098145 |
| 0 | bowl | 0.72 | 2444.689697 | -1.408806 | 2559.865479 | 396.303497 |
| 0 | cup | 0.98 | 120.385117 | 741.396301 | 703.488403 | 1423.120239 |
| 0 | donut | 0.82 | 1331.866333 | 146.230499 | 1958.745239 | 741.035278 |
| 0 | bowl | 0.80 | 1242.721924 | 728.814392 | 1856.770752 | 1345.256592 |
[13]:
# plot image with objects detected
od.plot_inference_objects(im, probability, boxes)

Example of timeseries with trend
[14]:
from datetime import datetime
import numpy as np
import pandas as pd

start = datetime(2024, 10, 15)
end = datetime(2024, 10, 16)
freq = "h"
rho, std = 0.5, 3
outlier_pct = 0.02
random_range_start, random_range_end = 10, 30
time_points = pd.date_range(start=start, end=end, freq=freq)
time_indices = np.arange(len(time_points))

trend = 100 + (2 / 96) * time_indices
daily = 4 * np.sin(2 * np.pi * time_indices / 24)
weekly = 20 * np.sin(2 * np.pi * time_indices / (24 * 7))
np.random.seed(42)
noise = np.zeros_like(time_indices, float)
for i in range(1, len(noise)):
    noise[i] = rho * noise[i - 1] + np.random.normal(0, std * np.sqrt(1 - rho**2))

ts_values = trend + daily + weekly + noise
n_out = int(len(ts_values) * outlier_pct)
idx_out = np.random.choice(len(ts_values), size=n_out, replace=False)
for idx in idx_out:
    if np.random.rand() < 0.5:
        ts_values[idx] += np.random.uniform(random_range_start, random_range_end)
    else:
        ts_values[idx] -= np.random.uniform(random_range_start, random_range_end)
Preprocessing
[15]:
from smltk.feature_engineering import Indicator
indicator = Indicator()
events = indicator.get_dc_events(ts_values)
starts = indicator.get_dc_events_starts(events, ts_values)
ends = indicator.get_dc_events_ends(events, ts_values)
Datavisualization
[16]:
events[:5]
[16]:
['upward overshoot',
 'upward overshoot',
 'upward overshoot',
 'upward overshoot',
 'upward overshoot']
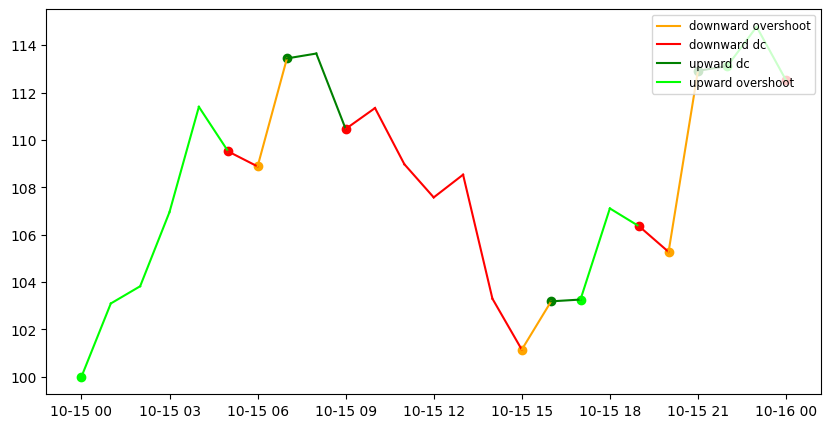
[17]:
# plot with dates and points where each directional changes events starts
dc_events = list(set(events))
params = {
    "timeseries": ts_values,
    "timestamp": time_points,
    "events": events,
    "dc_colors": {
        "upward dc":"green",
        "upward overshoot": "lime",
        "downward dc": "red",
        "downward overshoot": "orange"
    }
}
ax1 = indicator.plot_dc(params, True)
for event in dc_events:
    starts_event = [None if value == 0 else value for value in starts[event]]
    ax1.scatter(time_points, starts_event, color=params["dc_colors"][event])
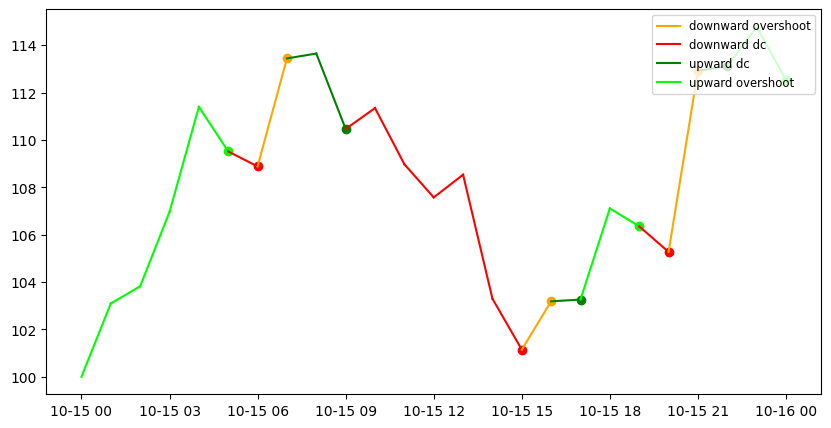
[18]:
# plot with dates and points where each directional changes events ends
ax1 = indicator.plot_dc(params, True)
for event in dc_events:
    ends_event = [None if value == 0 else value for value in ends[event]]
    ends_event = [None] + ends_event[:-1]
    ax1.scatter(time_points, ends_event, color=params["dc_colors"][event])
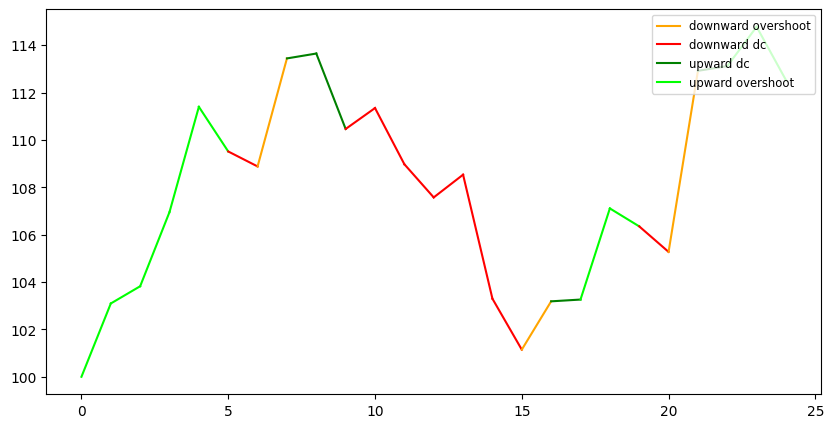
[19]:
# the same plot with int timestamp and without points
time_points = range(0, len(ts_values))
indicator.plot_dc({
    "timeseries": ts_values,
    "timestamp": time_points,
    "events": events,
    "dc_colors": {
        "upward dc":"green",
        "upward overshoot": "lime",
        "downward dc": "red",
        "downward overshoot": "orange"
    }
})
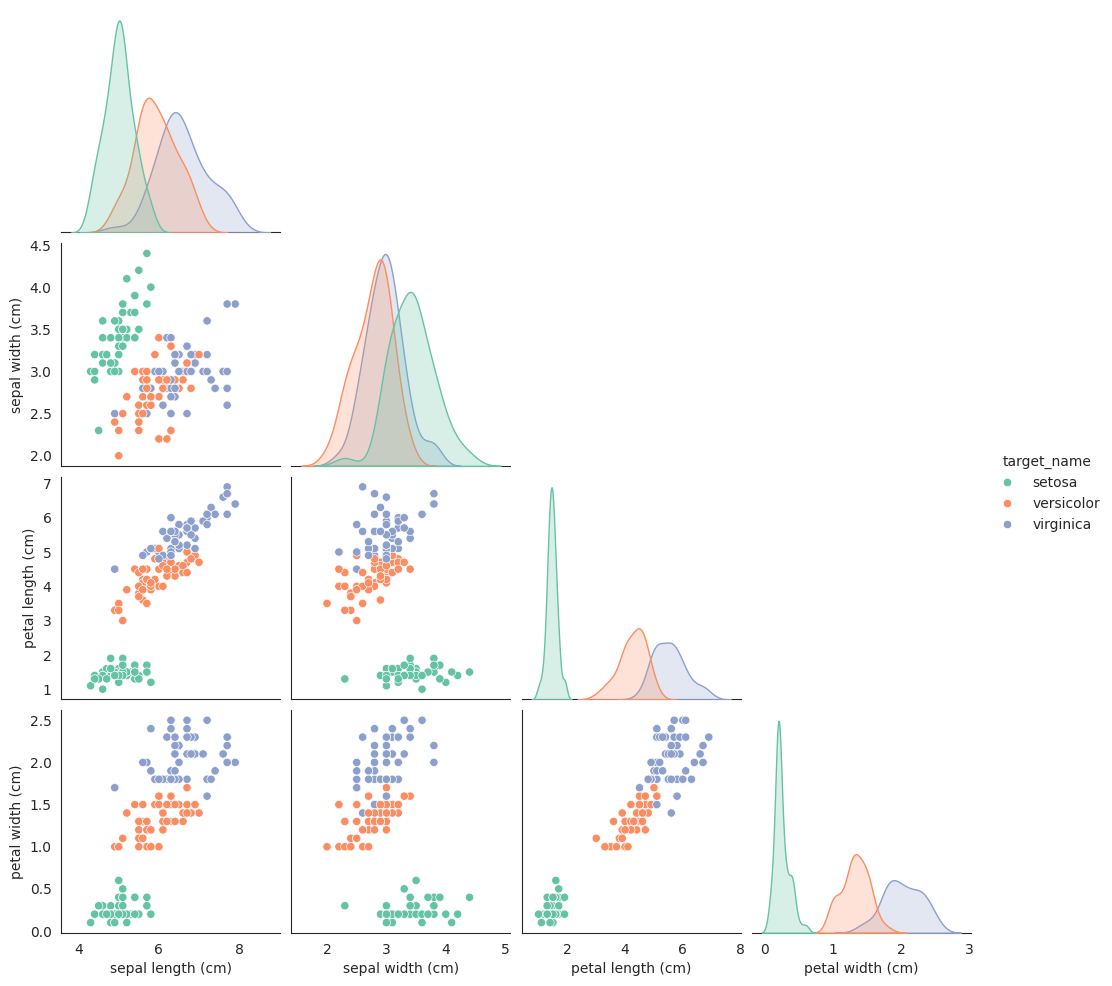
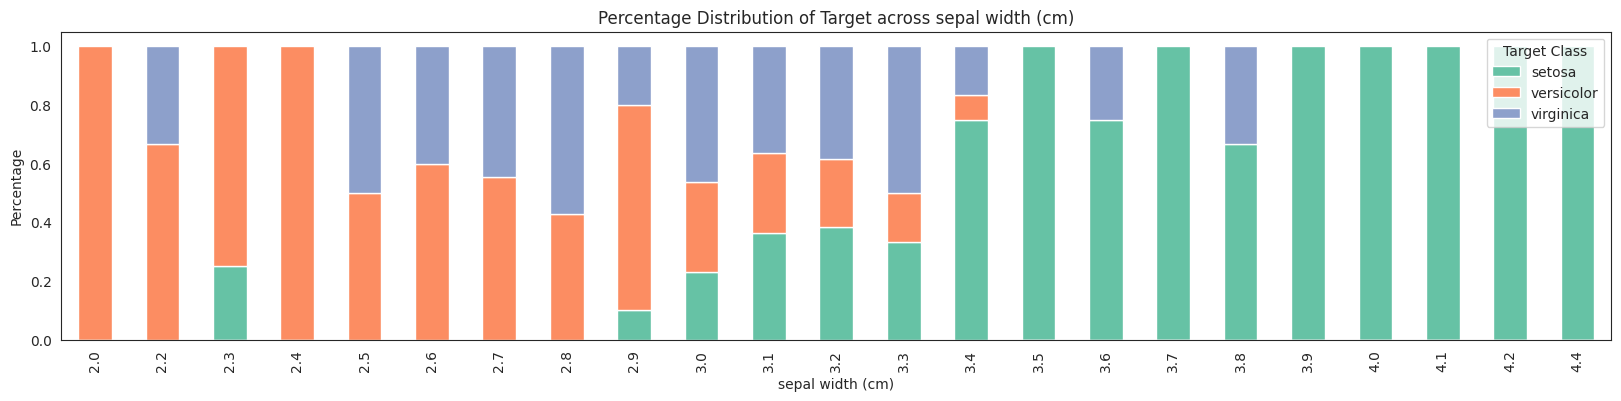
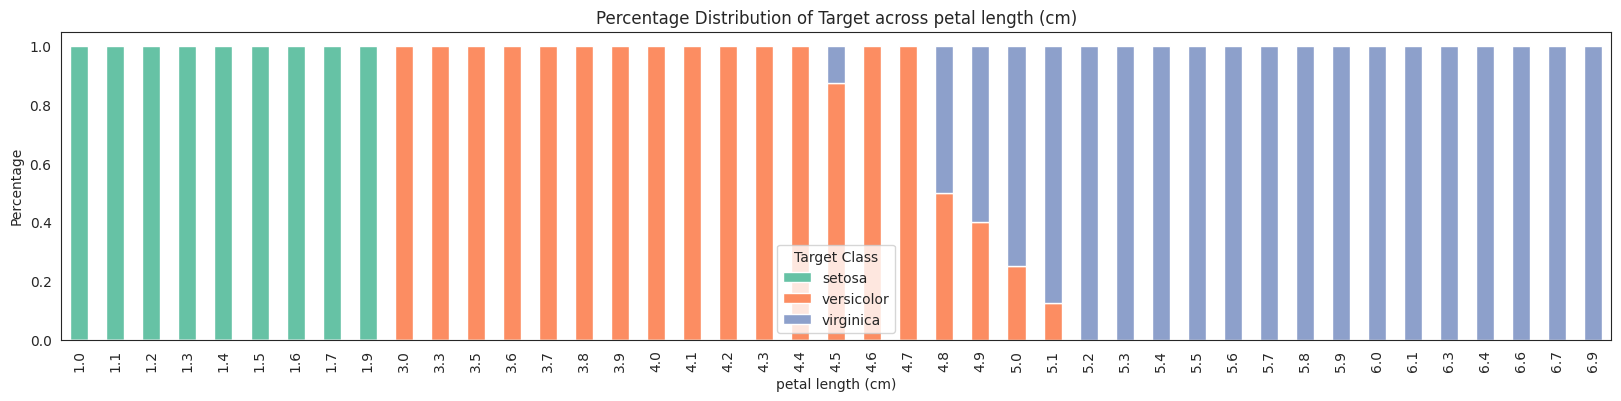
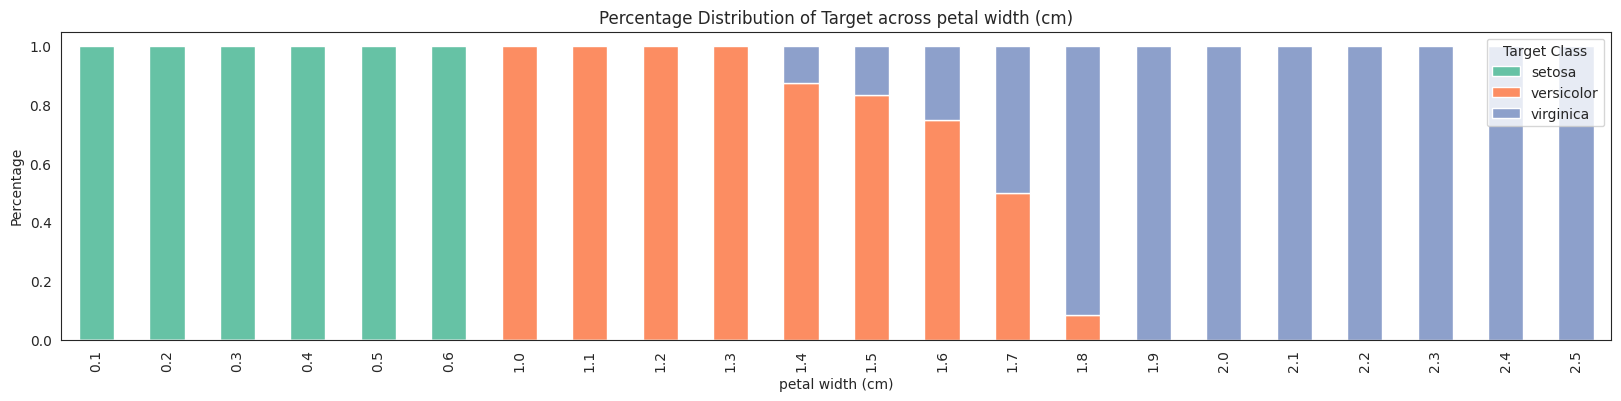
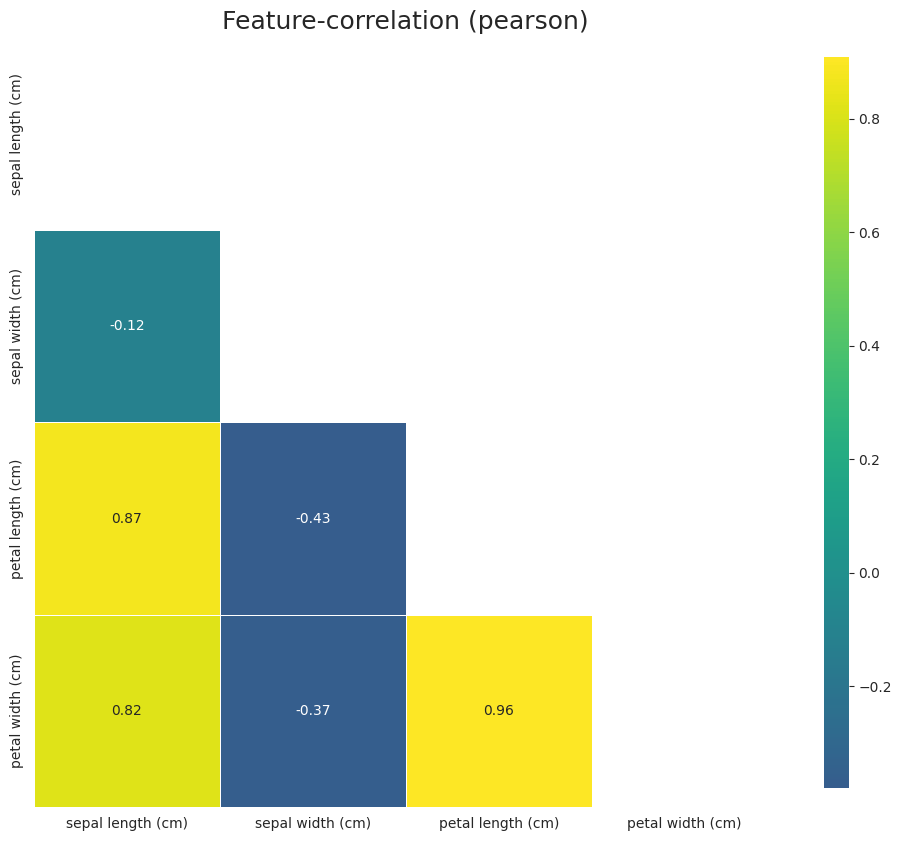
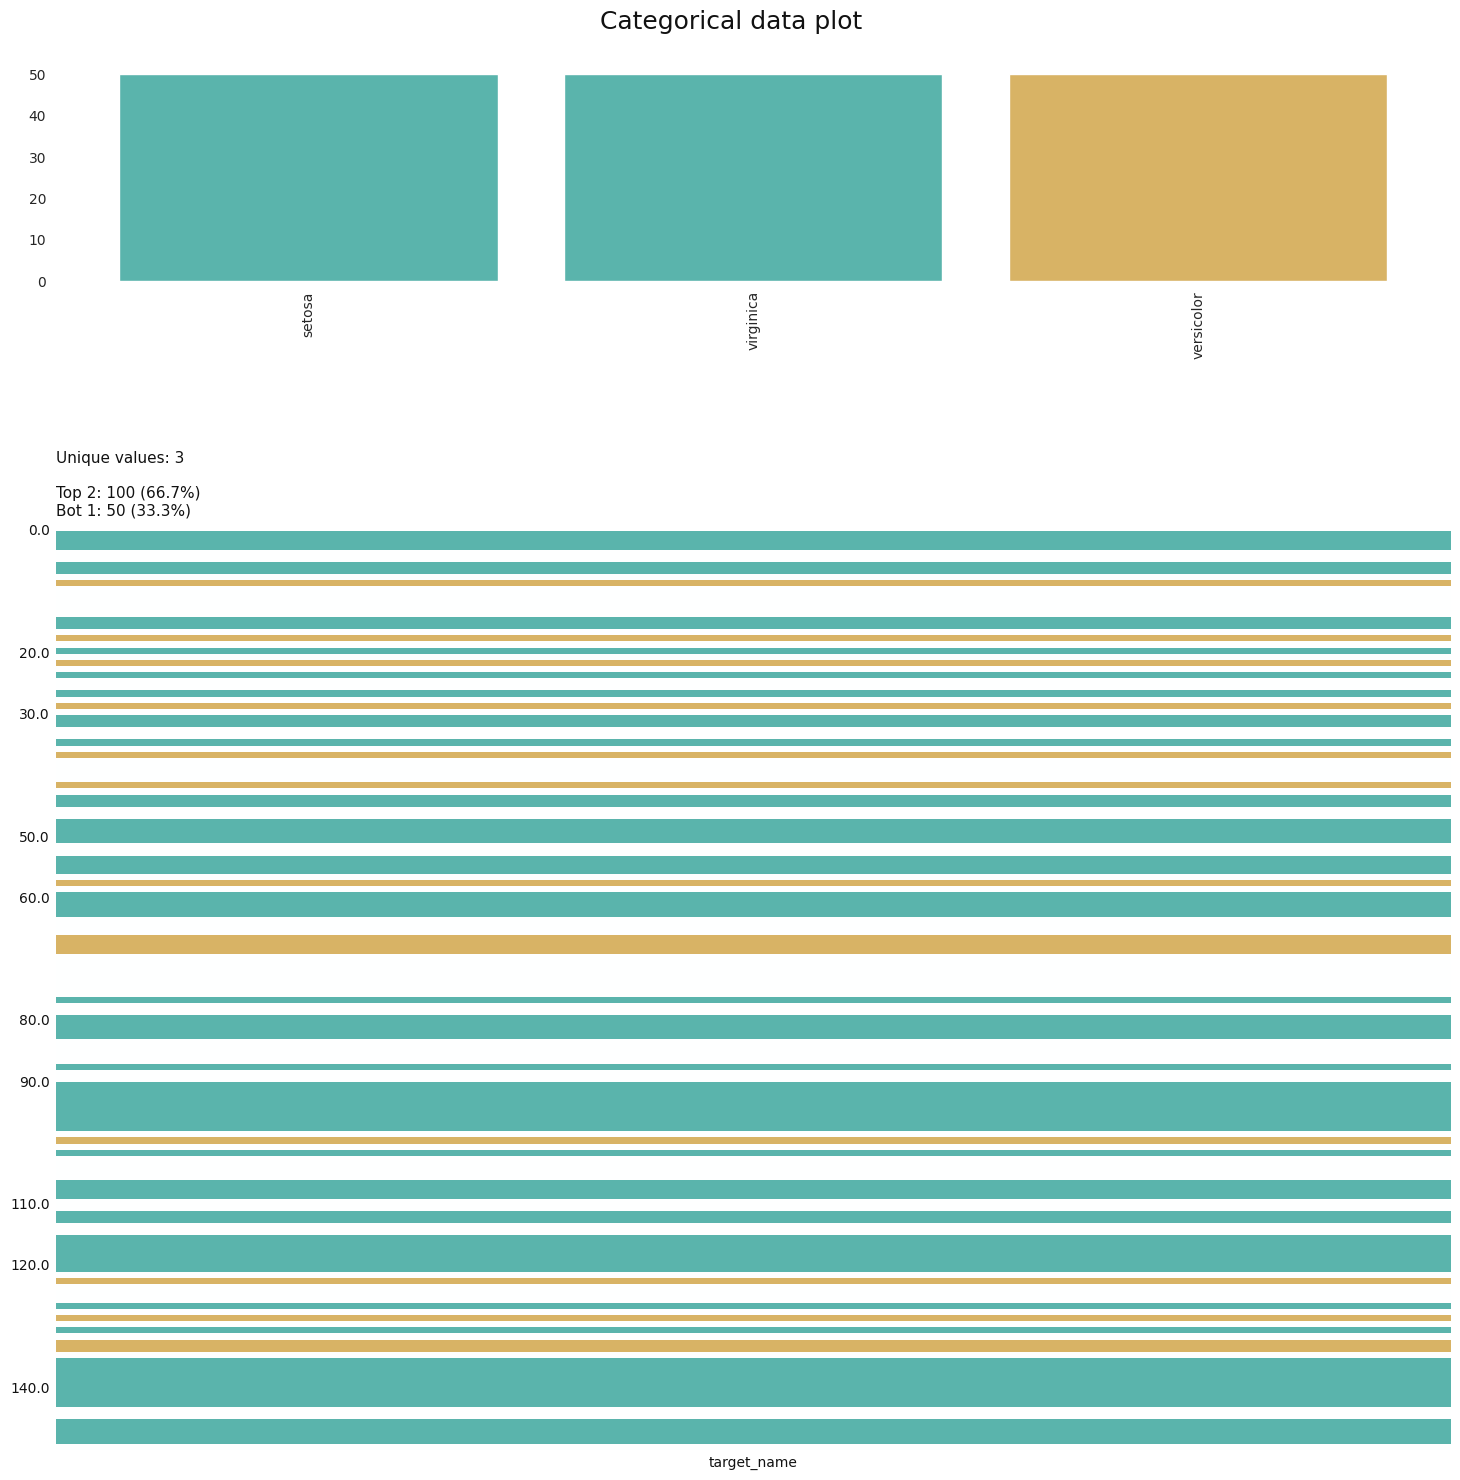
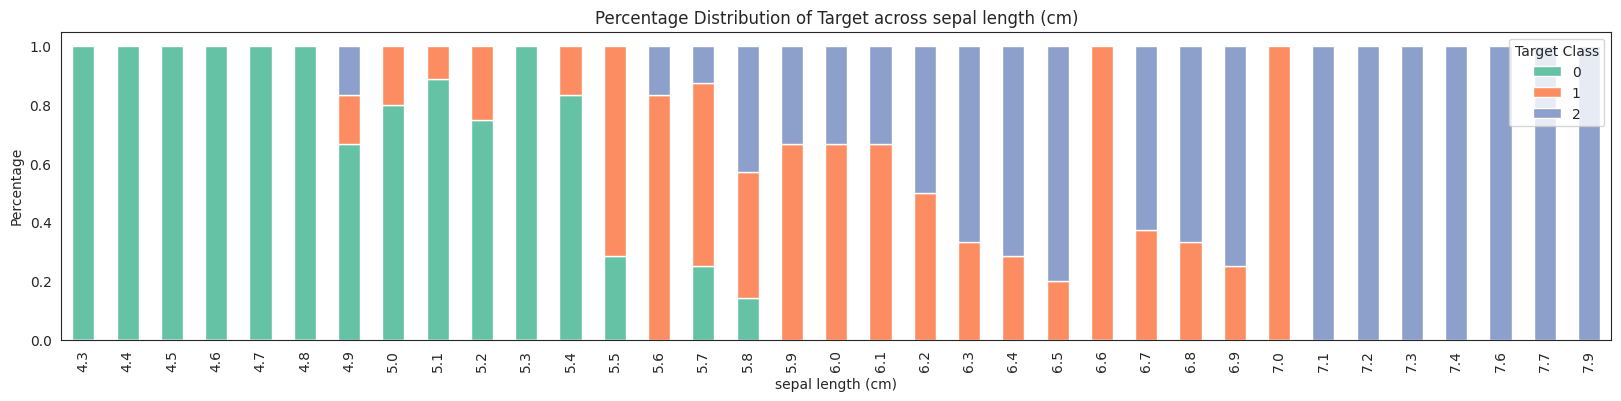
Example of EDA
[20]:
from smltk.data_analysis import DataAnalysis
da = DataAnalysis()
df = dp.get_df(data)
df["target"].unique()
[20]:
array([0, 1, 2])
[21]:
df["target_name"].unique()
[21]:
array([np.str_('setosa'), np.str_('versicolor'), np.str_('virginica')],
      dtype=object)
[22]:
df.columns
[22]:
Index(['target', 'target_name', 'sepal length (cm)', 'sepal width (cm)',
       'petal length (cm)', 'petal width (cm)'],
      dtype='object')
[23]:
df = df.drop("target", axis=1)
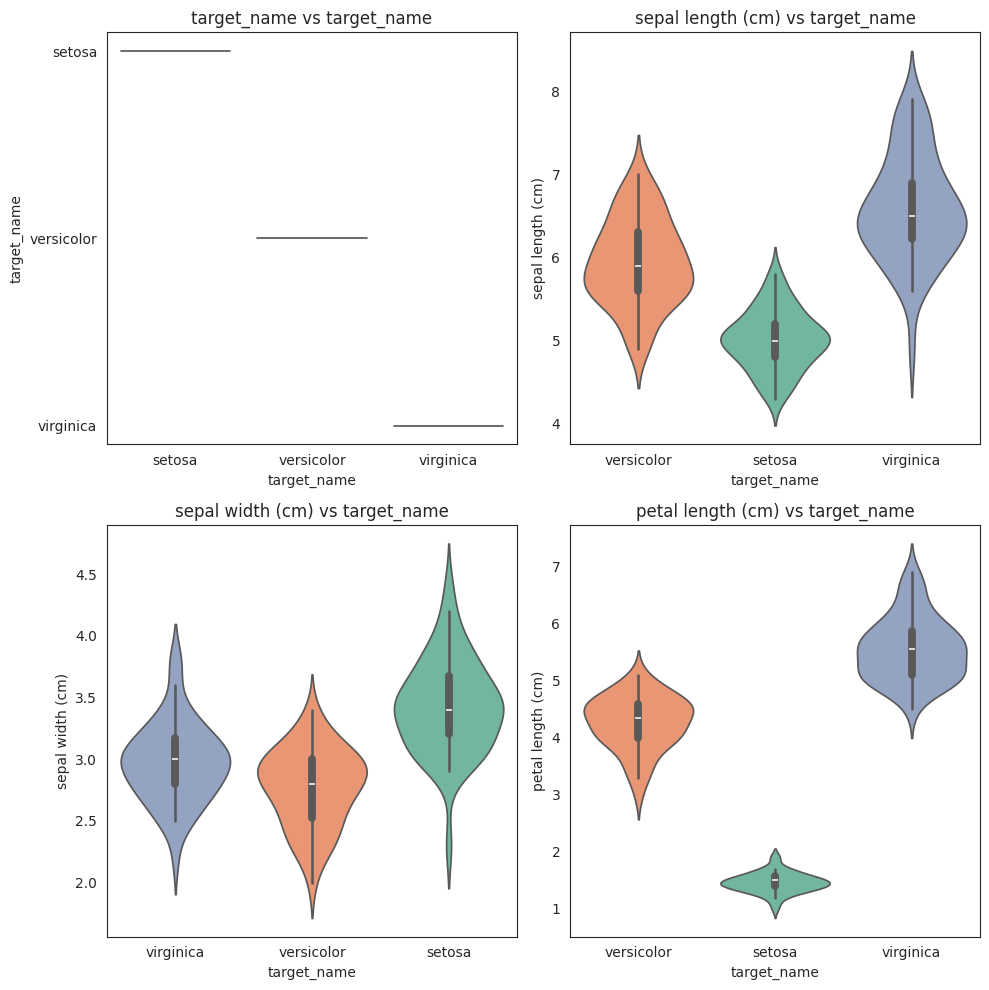
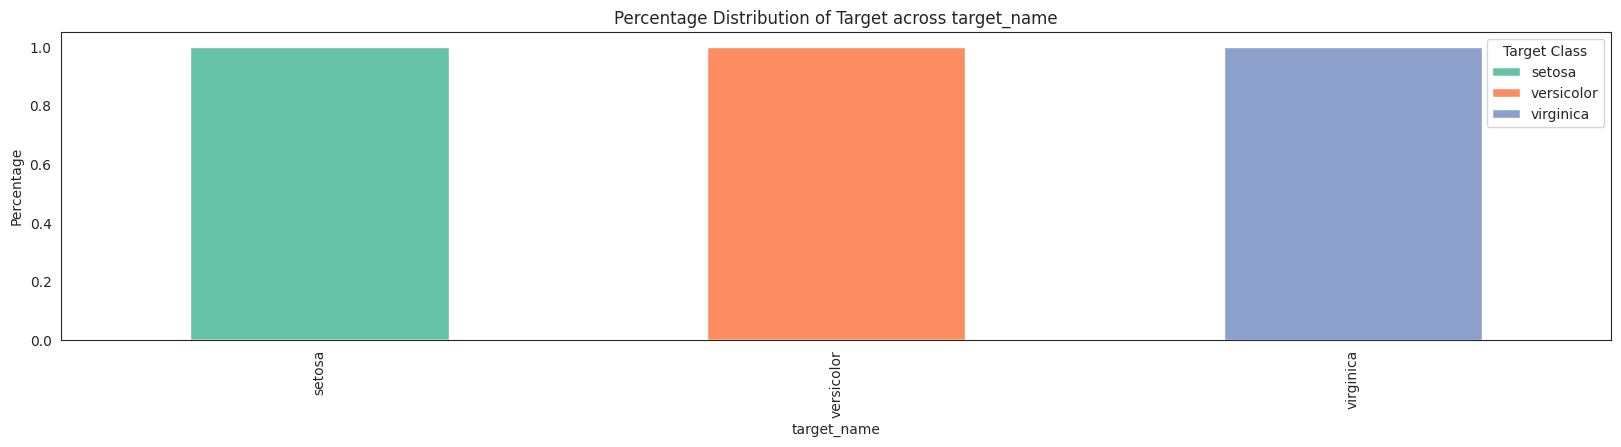
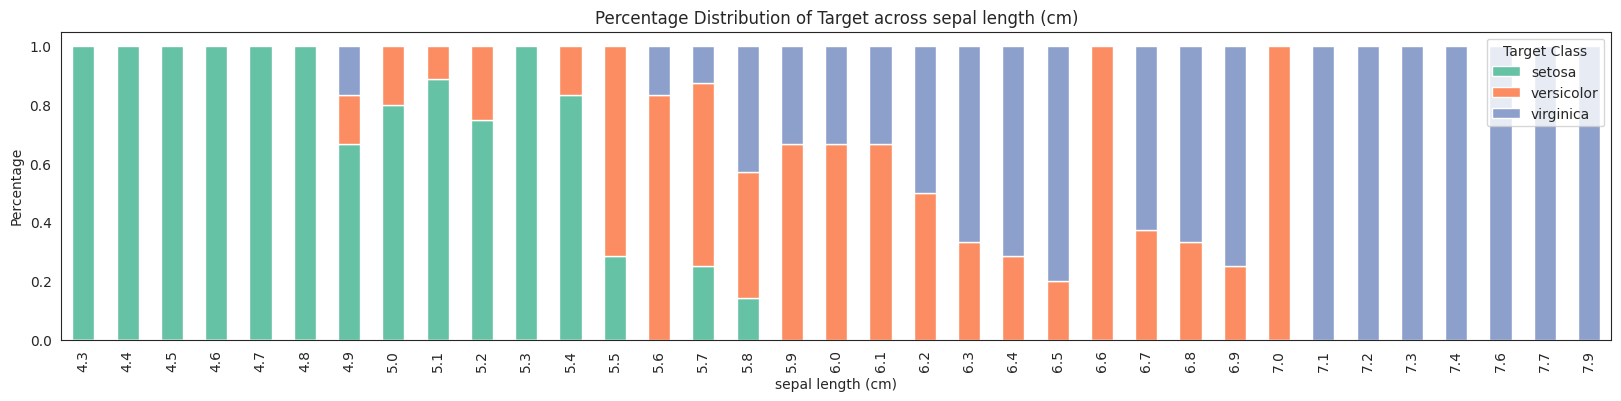
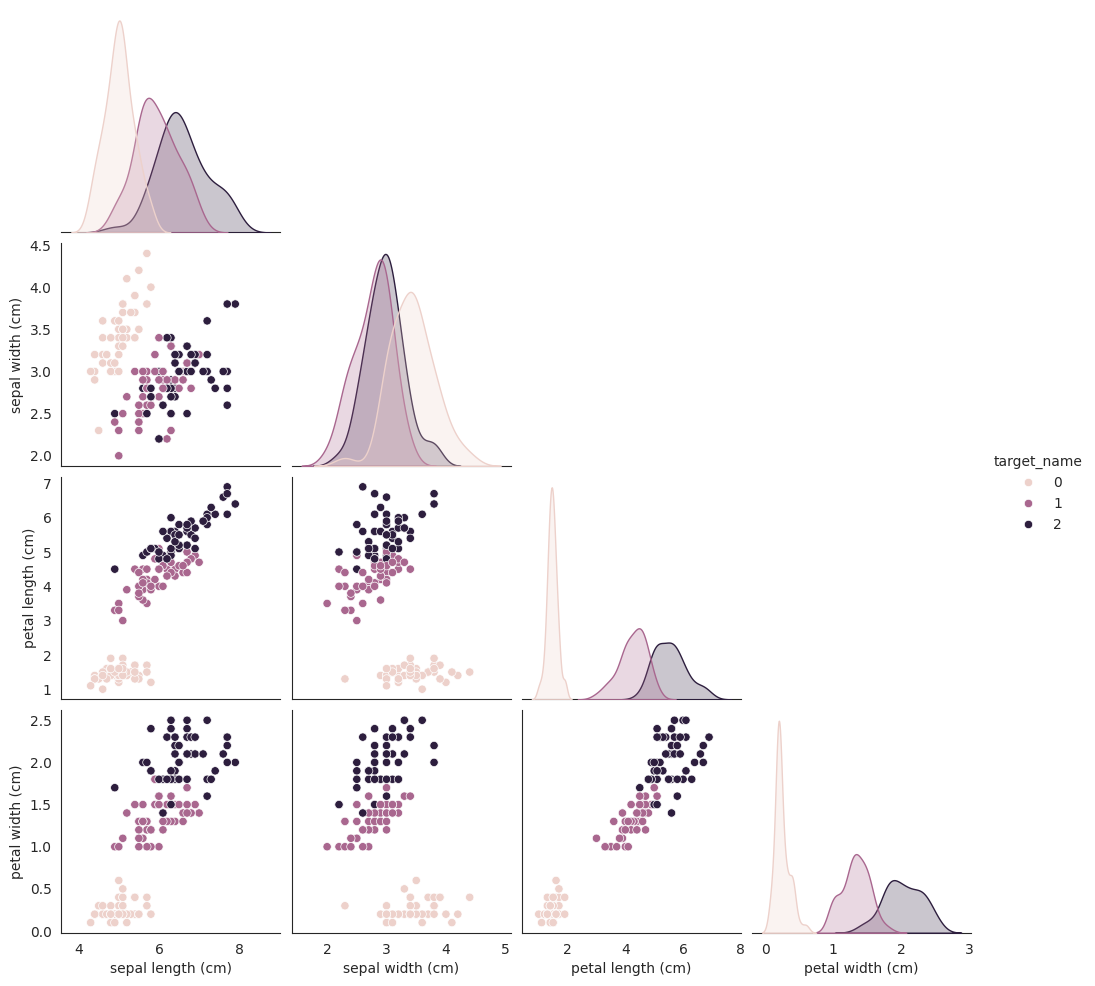
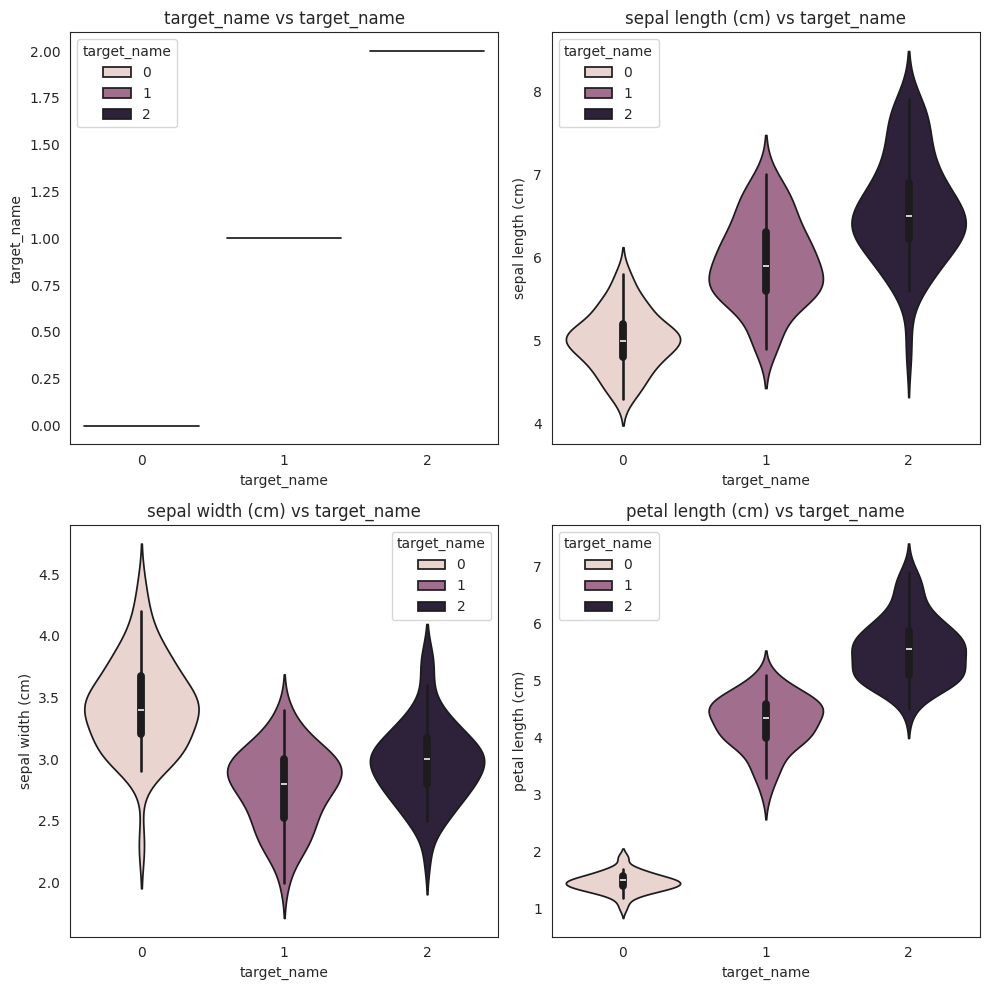
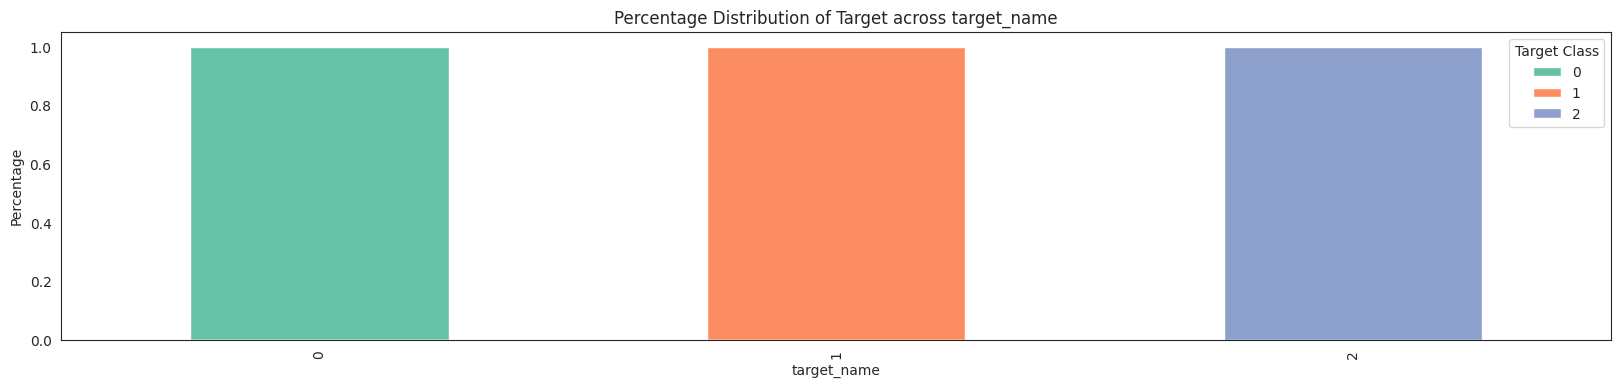
target = "target_name"
features = da.get_eda(target, df, {"sample.frac": 1})
/home/bilardi/github/bilardi/smltk/.env/lib64/python3.13/site-packages/sklearn/metrics/cluster/_supervised.py:58: UserWarning: Clustering metrics expects discrete values but received multiclass values for label, and continuous values for target
  warnings.warn(msg, UserWarning)
/home/bilardi/github/bilardi/smltk/.env/lib64/python3.13/site-packages/sklearn/metrics/cluster/_supervised.py:58: UserWarning: Clustering metrics expects discrete values but received multiclass values for label, and continuous values for target
  warnings.warn(msg, UserWarning)
/home/bilardi/github/bilardi/smltk/.env/lib64/python3.13/site-packages/sklearn/metrics/cluster/_supervised.py:58: UserWarning: Clustering metrics expects discrete values but received multiclass values for label, and continuous values for target
  warnings.warn(msg, UserWarning)
/home/bilardi/github/bilardi/smltk/.env/lib64/python3.13/site-packages/sklearn/metrics/cluster/_supervised.py:58: UserWarning: Clustering metrics expects discrete values but received multiclass values for label, and continuous values for target
  warnings.warn(msg, UserWarning)
/home/bilardi/github/bilardi/smltk/.env/lib64/python3.13/site-packages/sklearn/metrics/cluster/_supervised.py:58: UserWarning: Clustering metrics expects discrete values but received continuous values for label, and multiclass values for target
  warnings.warn(msg, UserWarning)
/home/bilardi/github/bilardi/smltk/.env/lib64/python3.13/site-packages/sklearn/metrics/cluster/_supervised.py:58: UserWarning: Clustering metrics expects discrete values but received continuous values for label, and multiclass values for target
  warnings.warn(msg, UserWarning)
/home/bilardi/github/bilardi/smltk/.env/lib64/python3.13/site-packages/sklearn/metrics/cluster/_supervised.py:58: UserWarning: Clustering metrics expects discrete values but received continuous values for label, and multiclass values for target
  warnings.warn(msg, UserWarning)
/home/bilardi/github/bilardi/smltk/.env/lib64/python3.13/site-packages/sklearn/metrics/cluster/_supervised.py:58: UserWarning: Clustering metrics expects discrete values but received continuous values for label, and multiclass values for target
  warnings.warn(msg, UserWarning)
No missing values found in the dataset.
[24]:
features
[24]:
{'data_amount': 150,
 'hue_order': [np.str_('setosa'), np.str_('versicolor'), np.str_('virginica')],
 'categorical_features': ['target_name'],
 'numerical_features': ['sepal length (cm)',
  'sepal width (cm)',
  'petal length (cm)',
  'petal width (cm)'],
 'data_missing': {'target_name': 0.0,
  'sepal length (cm)': 0.0,
  'sepal width (cm)': 0.0,
  'petal length (cm)': 0.0,
  'petal width (cm)': 0.0},
 'correlations': {'cramers_v': Empty DataFrame
  Columns: []
  Index: [],
  'mutual_info': Empty DataFrame
  Columns: []
  Index: []}}
[25]:
categorical_features, df = dp.transform_categories(df)
categorical_features
[25]:
{'target_name': Index(['setosa', 'versicolor', 'virginica'], dtype='object')}
[26]:
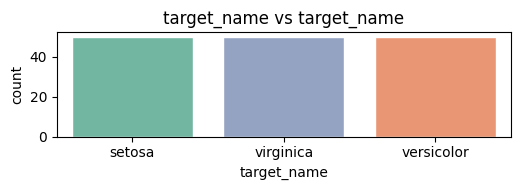
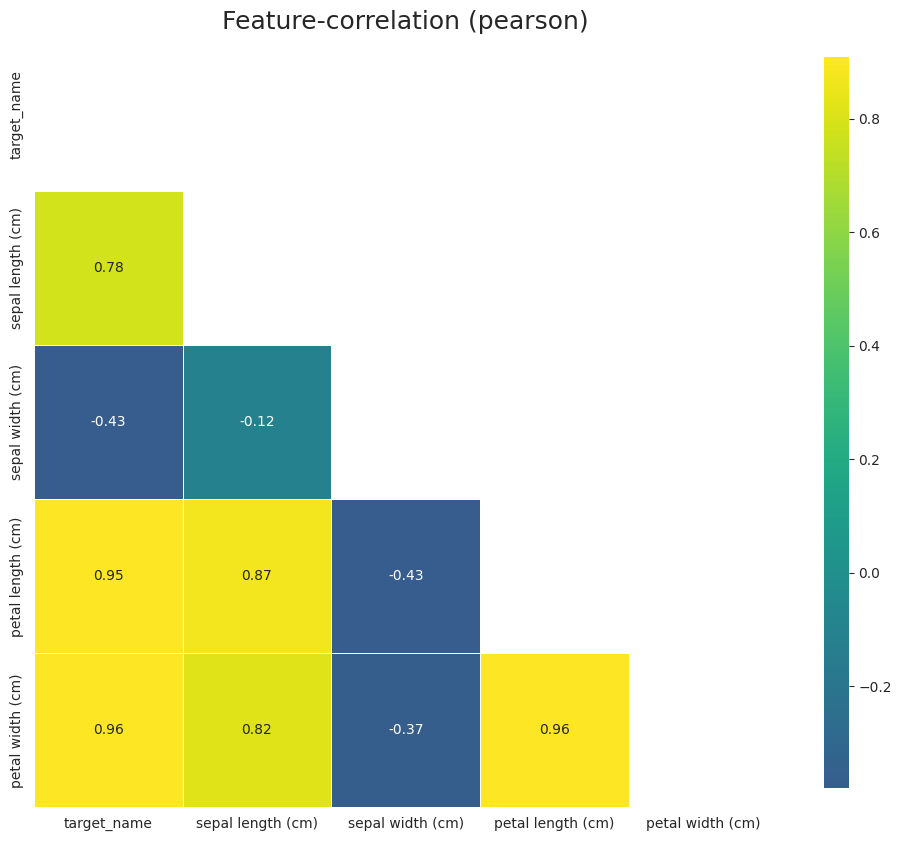
features = da.get_eda(target, df, {"sample.frac": 1})
<Figure size 1000x0 with 0 Axes>
No missing values found in the dataset.
No columns with categorical data were detected.
[27]:
features
[27]:
{'data_amount': 150,
 'hue_order': [0, 1, 2],
 'categorical_features': [],
 'numerical_features': ['target_name',
  'sepal length (cm)',
  'sepal width (cm)',
  'petal length (cm)',
  'petal width (cm)'],
 'data_missing': {'target_name': 0.0,
  'sepal length (cm)': 0.0,
  'sepal width (cm)': 0.0,
  'petal length (cm)': 0.0,
  'petal width (cm)': 0.0},
 'correlations': {'pearson': Empty DataFrame
  Columns: []
  Index: [],
  'spearman': Empty DataFrame
  Columns: []
  Index: [],
  'kendall': Empty DataFrame
  Columns: []
  Index: []}}