Datavisualization
The package only contains methods to simplify your code, so it doesn’t cover all steps of machine learning process, but only those that save you lines of code.
[1]:
#!pip install smltk==2.2.9

# import os
# import sys
# sys.path.insert(1, os.getcwd() + '/../../../')
# print(os.getcwd())
# print(sys.path)

from smltk.datavisualization import DataVisualization
dv = DataVisualization()
Example with sklearn library - iris dataset
[2]:
from sklearn.datasets import load_iris
data = load_iris()
Datavisualization
[3]:
dv.get_df(data).head(5)
[3]:
| target | target_name | sepal length (cm) | sepal width (cm) | petal length (cm) | petal width (cm) | |
|---|---|---|---|---|---|---|
| 0 | 0 | setosa | 5.1 | 3.5 | 1.4 | 0.2 |
| 1 | 0 | setosa | 4.9 | 3.0 | 1.4 | 0.2 |
| 2 | 0 | setosa | 4.7 | 3.2 | 1.3 | 0.2 |
| 3 | 0 | setosa | 4.6 | 3.1 | 1.5 | 0.2 |
| 4 | 0 | setosa | 5.0 | 3.6 | 1.4 | 0.2 |
Preprocessing
[4]:
# splitting
from sklearn.model_selection import train_test_split
X_train, X_test, y_train, y_test = train_test_split(data.data, data.target, test_size=0.2, random_state=5)
Modeling
[5]:
# fitting
from sklearn.linear_model import SGDClassifier
model = SGDClassifier(random_state=3)
_ = model.fit(X_train, y_train)
[6]:
# testing
y_pred = model.predict(X_test)
Datavisualization
[7]:
dv.get_inference_df(data, X_test, y_test, y_pred).head(5)
[7]:
| prediction | target | target_name | sepal length (cm) | sepal width (cm) | petal length (cm) | petal width (cm) | |
|---|---|---|---|---|---|---|---|
| 0 | 1 | 1 | versicolor | 5.8 | 2.7 | 3.9 | 1.2 |
| 1 | 2 | 2 | virginica | 6.1 | 2.6 | 5.6 | 1.4 |
| 2 | 2 | 2 | virginica | 5.8 | 2.8 | 5.1 | 2.4 |
| 3 | 0 | 0 | setosa | 4.4 | 3.2 | 1.3 | 0.2 |
| 4 | 2 | 2 | virginica | 7.2 | 3.6 | 6.1 | 2.5 |
Example with torch library - image dataset
[8]:
import requests
from PIL import Image
url = 'https://www.projectinvictus.it/wp-content/uploads/2022/08/junk-food-scaled.jpg'
im = Image.open(requests.get(url, stream=True).raw)
Preprocessing
[9]:
# data preparation
import torchvision.transforms as transforms
transform = transforms.Compose([ transforms.Resize(800), transforms.ToTensor() ])
img = transform(im).unsqueeze(0)
Modeling
[10]:
# load pre-trained model instead to train it
import torch
model = torch.hub.load('facebookresearch/detr', 'detr_resnet50', pretrained=True)
model.eval();
Using cache found in /Users/alessandrabilardi/.cache/torch/hub/facebookresearch_detr_main
/Users/alessandrabilardi/github/corley/moretti-conta-pizze/.env/lib/python3.12/site-packages/torchvision/models/_utils.py:208: UserWarning: The parameter 'pretrained' is deprecated since 0.13 and may be removed in the future, please use 'weights' instead.
  warnings.warn(
/Users/alessandrabilardi/github/corley/moretti-conta-pizze/.env/lib/python3.12/site-packages/torchvision/models/_utils.py:223: UserWarning: Arguments other than a weight enum or `None` for 'weights' are deprecated since 0.13 and may be removed in the future. The current behavior is equivalent to passing `weights=ResNet50_Weights.IMAGENET1K_V1`. You can also use `weights=ResNet50_Weights.DEFAULT` to get the most up-to-date weights.
  warnings.warn(msg)
[11]:
# fitting
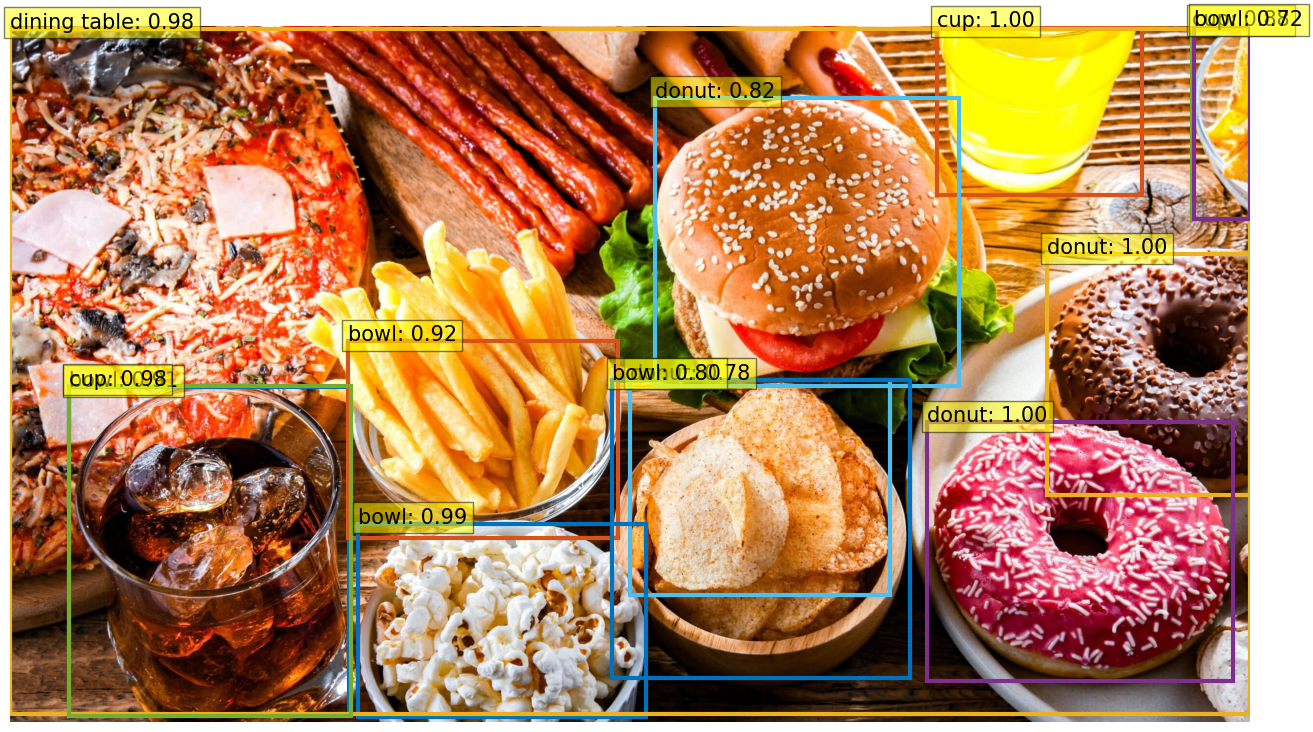
prediction = model(img)
probability, boxes = dv.get_inference_objects(im, prediction, 0.7)
Datavisualization
[12]:
# pretty view of prediction
dv.get_inference_objects_df(probability, boxes)
[12]:
| class | probability | xmin | ymin | xmax | ymax | |
|---|---|---|---|---|---|---|
| 0 | bowl | 0.91 | 121.080093 | 743.921936 | 698.561768 | 1422.093506 |
| 0 | bowl | 0.92 | 696.310791 | 649.603455 | 1255.190918 | 1054.840576 |
| 0 | donut | 1.00 | 2140.089355 | 469.912140 | 2559.624512 | 966.051208 |
| 0 | donut | 1.00 | 1892.986938 | 816.611267 | 2523.677246 | 1351.426514 |
| 0 | cup | 0.88 | 2440.144043 | -1.122692 | 2559.945312 | 397.894653 |
| 0 | donut | 0.78 | 1279.640259 | 728.656555 | 1816.003418 | 1172.515991 |
| 0 | bowl | 0.99 | 718.509521 | 1025.902588 | 1311.592041 | 1424.917969 |
| 0 | cup | 1.00 | 1913.084106 | 1.166066 | 2337.077148 | 347.949921 |
| 0 | dining table | 0.98 | -0.428162 | 4.530998 | 2559.098877 | 1419.098145 |
| 0 | bowl | 0.72 | 2444.689697 | -1.408870 | 2559.865479 | 396.303345 |
| 0 | cup | 0.98 | 120.385017 | 741.396362 | 703.488464 | 1423.120361 |
| 0 | donut | 0.82 | 1331.866333 | 146.230499 | 1958.745239 | 741.035278 |
| 0 | bowl | 0.80 | 1242.721924 | 728.814514 | 1856.770630 | 1345.256470 |
[13]:
# plot image with objects detected
dv.plot_inference_objects(im, probability, boxes)
Example with mockseries library - timeseries with trend
[14]:
from datetime import datetime, timedelta
from mockseries.utils import datetime_range
from mockseries.trend import LinearTrend
from mockseries.seasonality import SinusoidalSeasonality
from mockseries.noise import RedNoise
trend = LinearTrend(coefficient=2, time_unit=timedelta(days=4), flat_base=100)
seasonality = SinusoidalSeasonality(amplitude=20, period=timedelta(days=7)) \
              + SinusoidalSeasonality(amplitude=4, period=timedelta(days=1))
noise = RedNoise(mean=0, std=3, correlation=0.5)
timeseries = trend + seasonality + noise
time_points = datetime_range(
    granularity=timedelta(hours=1),
    start_time=datetime(2024, 10, 15),
    end_time=datetime(2024, 10, 16),
)
ts_values = timeseries.generate(time_points=time_points)
Preprocessing
[15]:
from smltk.preprocessing import Indicator
indicator = Indicator()
events = indicator.get_dc_events(ts_values)
starts = indicator.get_dc_events_starts(events, ts_values)
[nltk_data] Downloading package punkt_tab to
[nltk_data]     /Users/alessandrabilardi/nltk_data...
[nltk_data]   Package punkt_tab is already up-to-date!
[nltk_data] Downloading package wordnet to
[nltk_data]     /Users/alessandrabilardi/nltk_data...
[nltk_data]   Package wordnet is already up-to-date!
[nltk_data] Downloading package omw-1.4 to
[nltk_data]     /Users/alessandrabilardi/nltk_data...
[nltk_data]   Package omw-1.4 is already up-to-date!
[nltk_data] Downloading package stopwords to
[nltk_data]     /Users/alessandrabilardi/nltk_data...
[nltk_data]   Package stopwords is already up-to-date!
[nltk_data] Downloading package averaged_perceptron_tagger_eng to
[nltk_data]     /Users/alessandrabilardi/nltk_data...
[nltk_data]   Package averaged_perceptron_tagger_eng is already up-to-
[nltk_data]       date!
[nltk_data] Downloading package vader_lexicon to
[nltk_data]     /Users/alessandrabilardi/nltk_data...
[nltk_data]   Package vader_lexicon is already up-to-date!
Datavisualization
[16]:
events[:5]
[16]:
['upward overshoot',
 'upward overshoot',
 'downward dc',
 'downward overshoot',
 'downward overshoot']
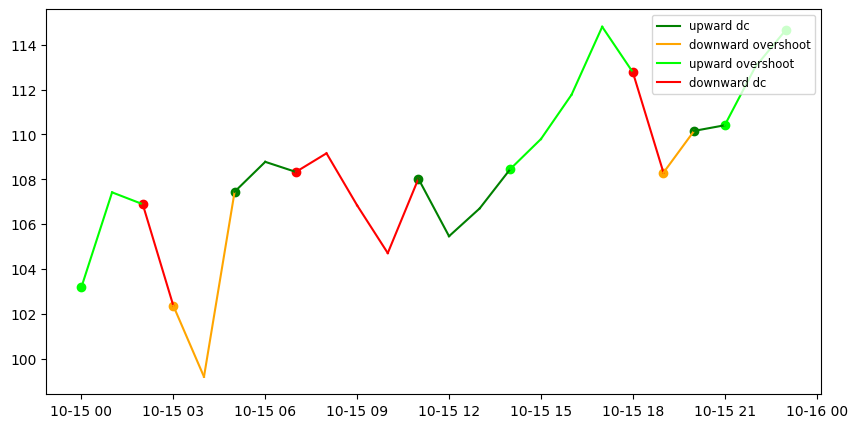
[17]:
# plot with dates and points where each directional changes events starts
dc_events = list(set(events))
params = {
    "timeseries": ts_values,
    "timestamp": time_points,
    "events": events,
    "dc_colors": {
        "upward dc":"green",
        "upward overshoot": "lime",
        "downward dc": "red",
        "downward overshoot": "orange"
    }
}
ax1 = dv.plot_dc(params, True)
for event in dc_events:
    starts_event = [None if value == 0 else value for value in starts[event]]
    ax1.scatter(time_points, starts_event, color=params["dc_colors"][event])
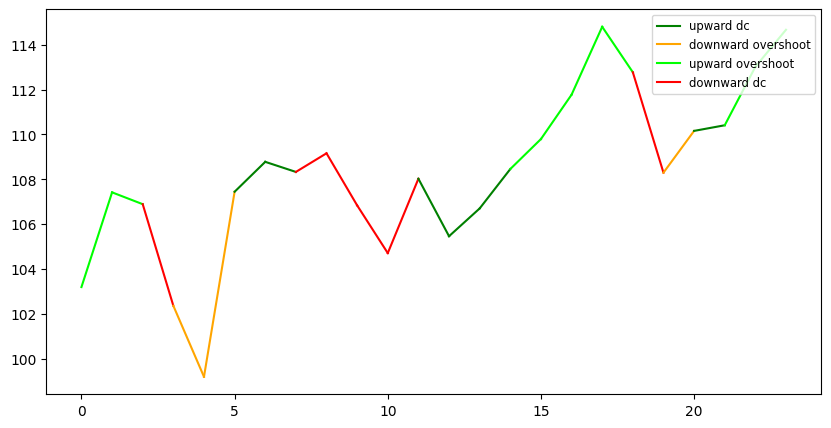
[18]:
# the same plot with int timestamp and without points
time_points = range(0, len(ts_values))
params = {
    "timeseries": ts_values,
    "timestamp": time_points,
    "events": events,
    "dc_colors": {
        "upward dc":"green",
        "upward overshoot": "lime",
        "downward dc": "red",
        "downward overshoot": "orange"
    }
}
dv.plot_dc(params)